Infographic and report design in print and on screen
A report full of good work, or a survey with thousands of results, only helps if people can find what matters in it. We design infographics, annual and impact reports, and interactive data that readers can explore, so the key findings are clear.
How we make a report clear
From the raw numbers to a finished report.
Reports, infographics and animations we have designed include the Peoples’ Climate Vote, the Energy Saving Trust, water2business, Anderson Group, Conergy and Anthony Collins Solicitors.
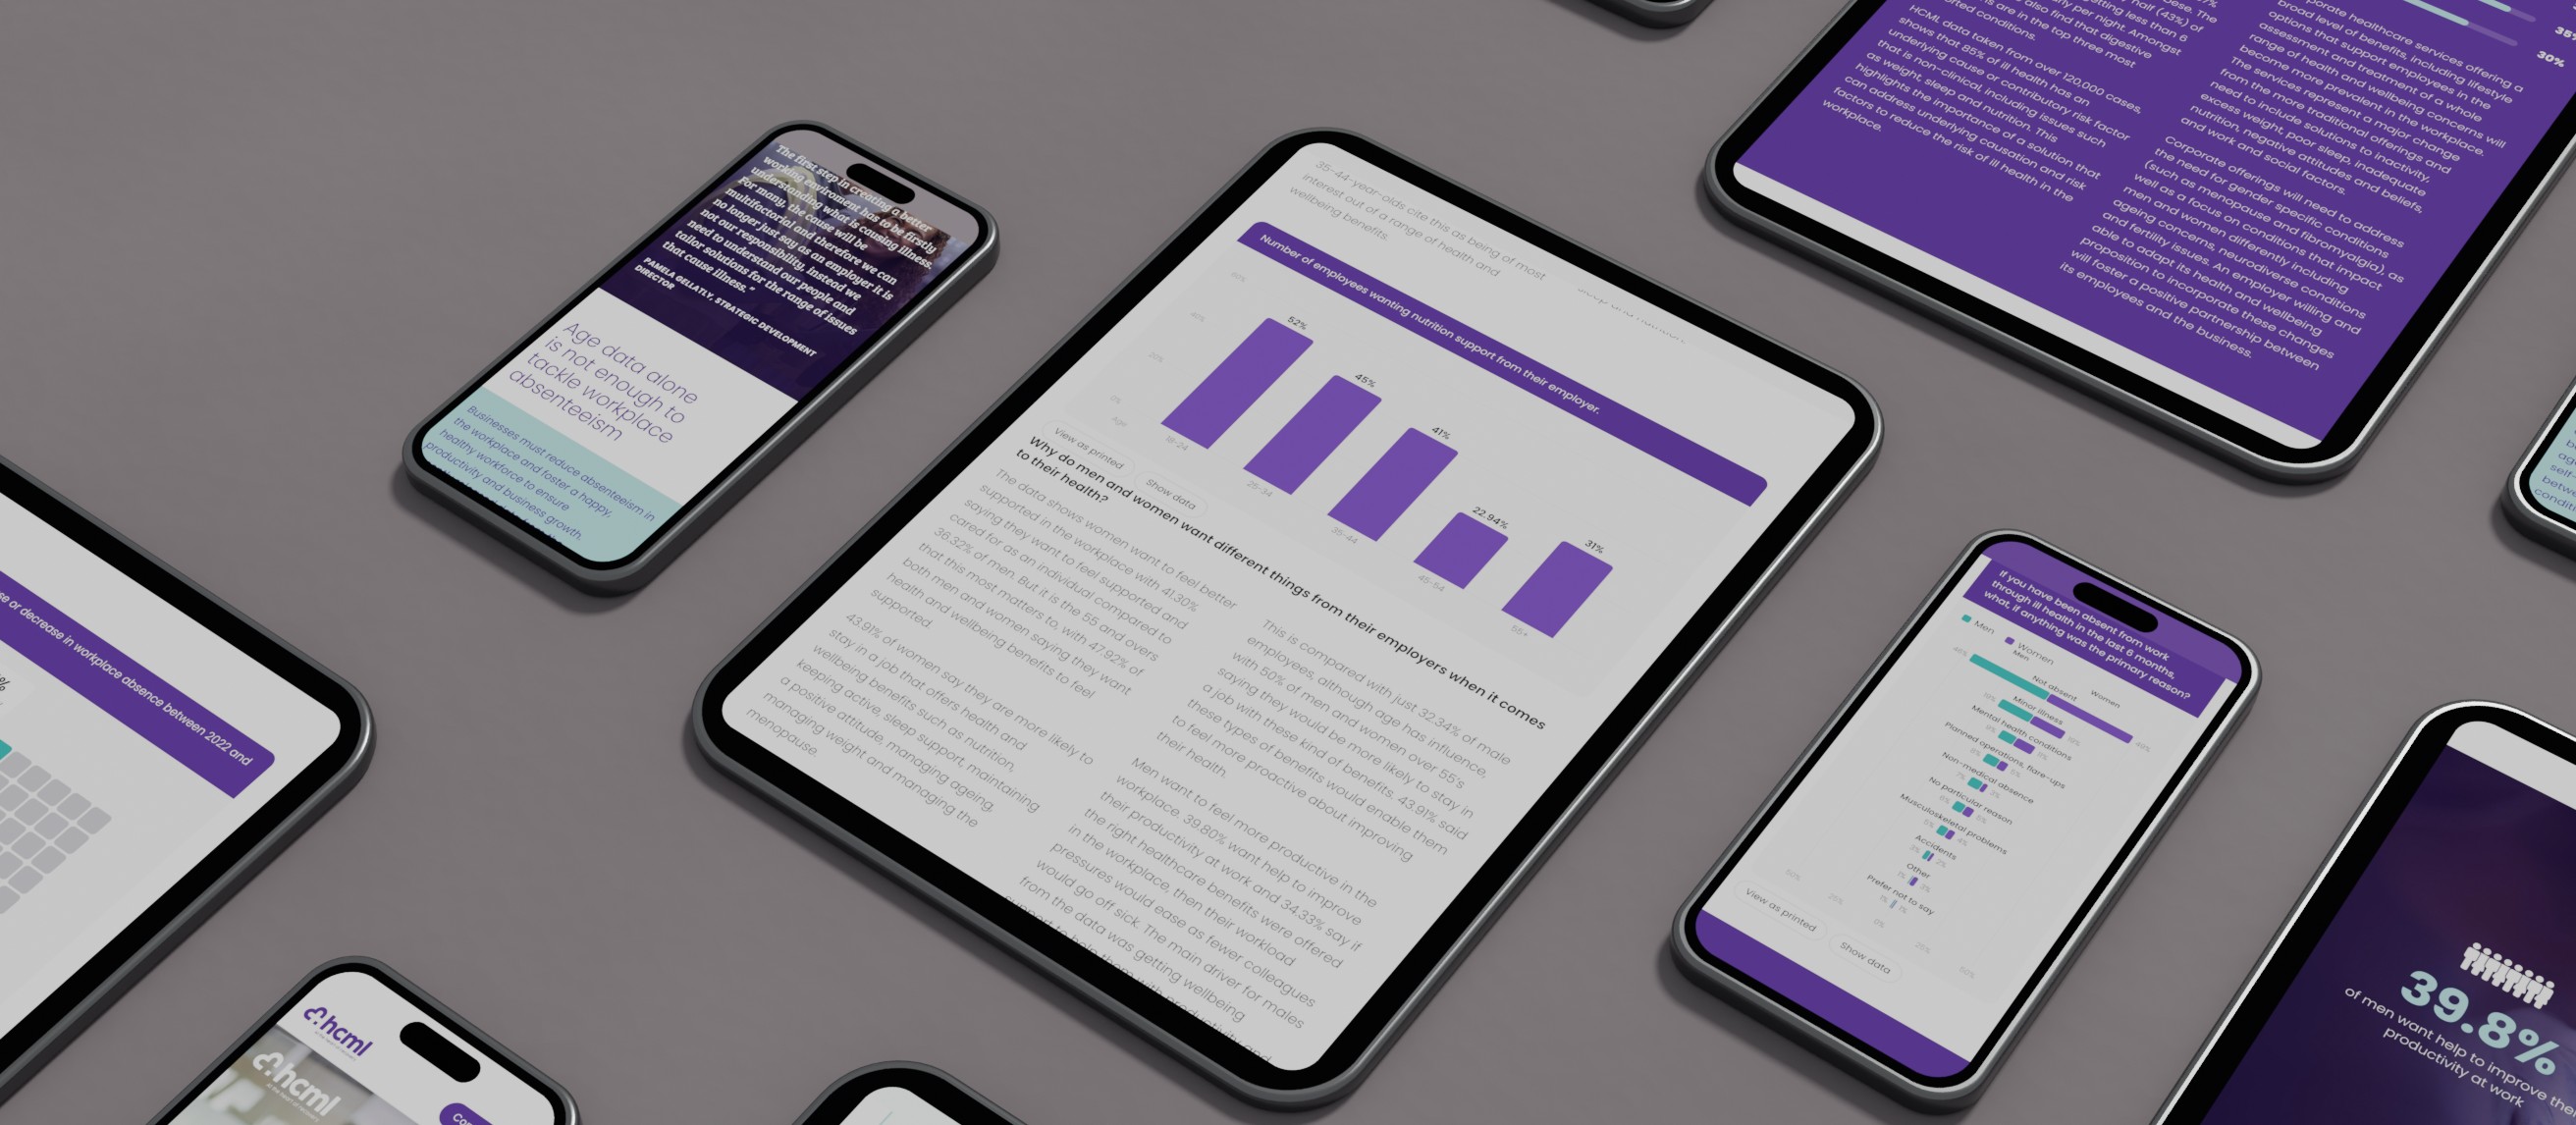
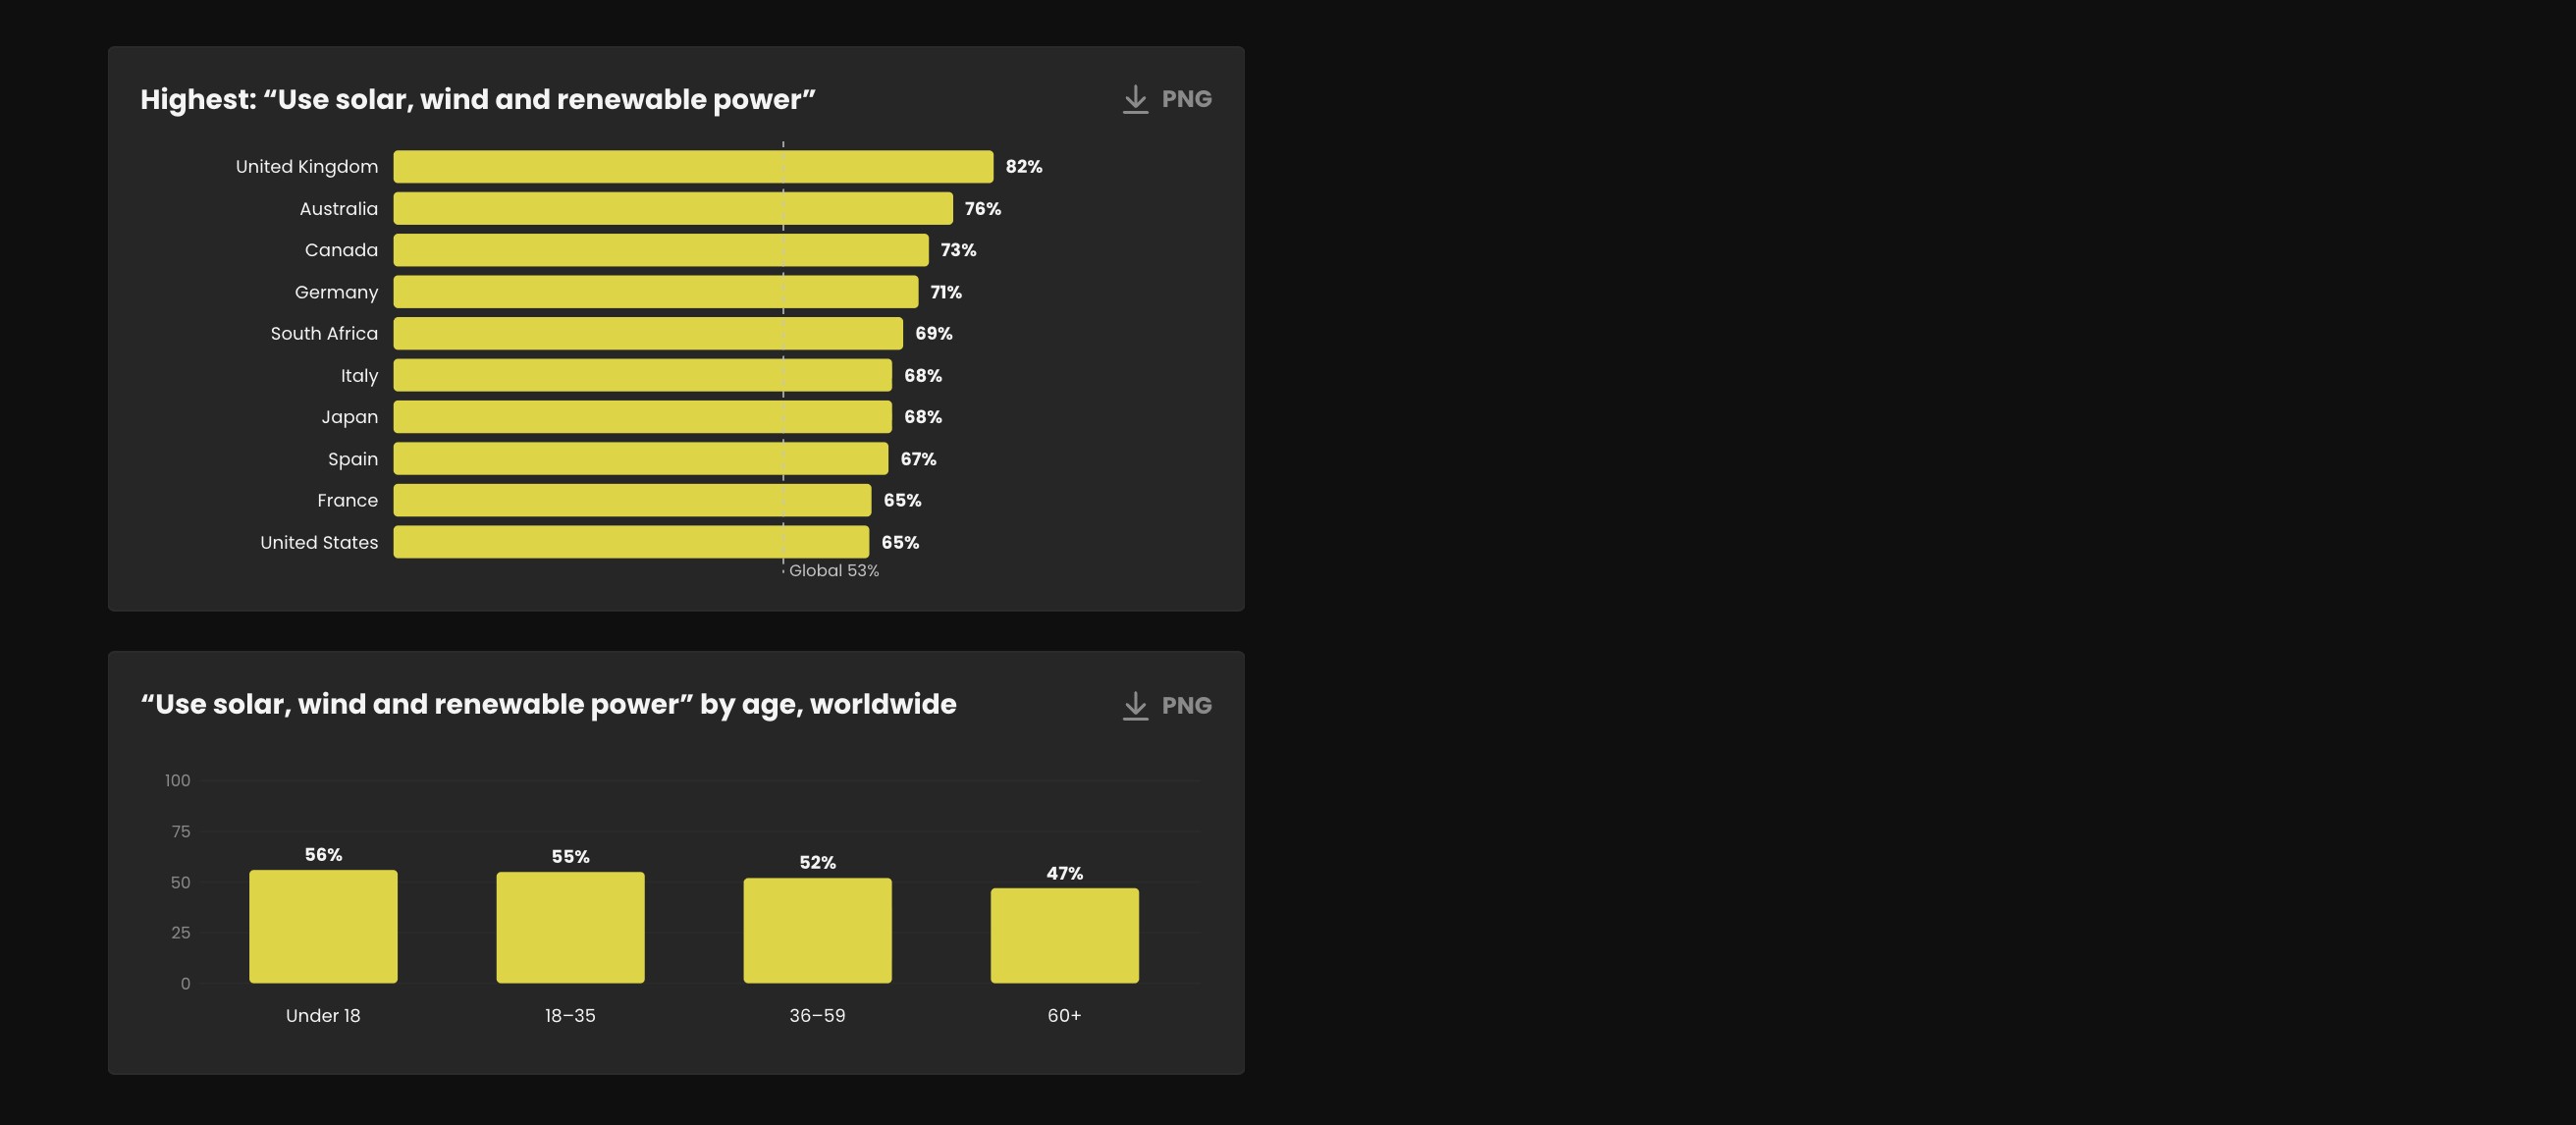
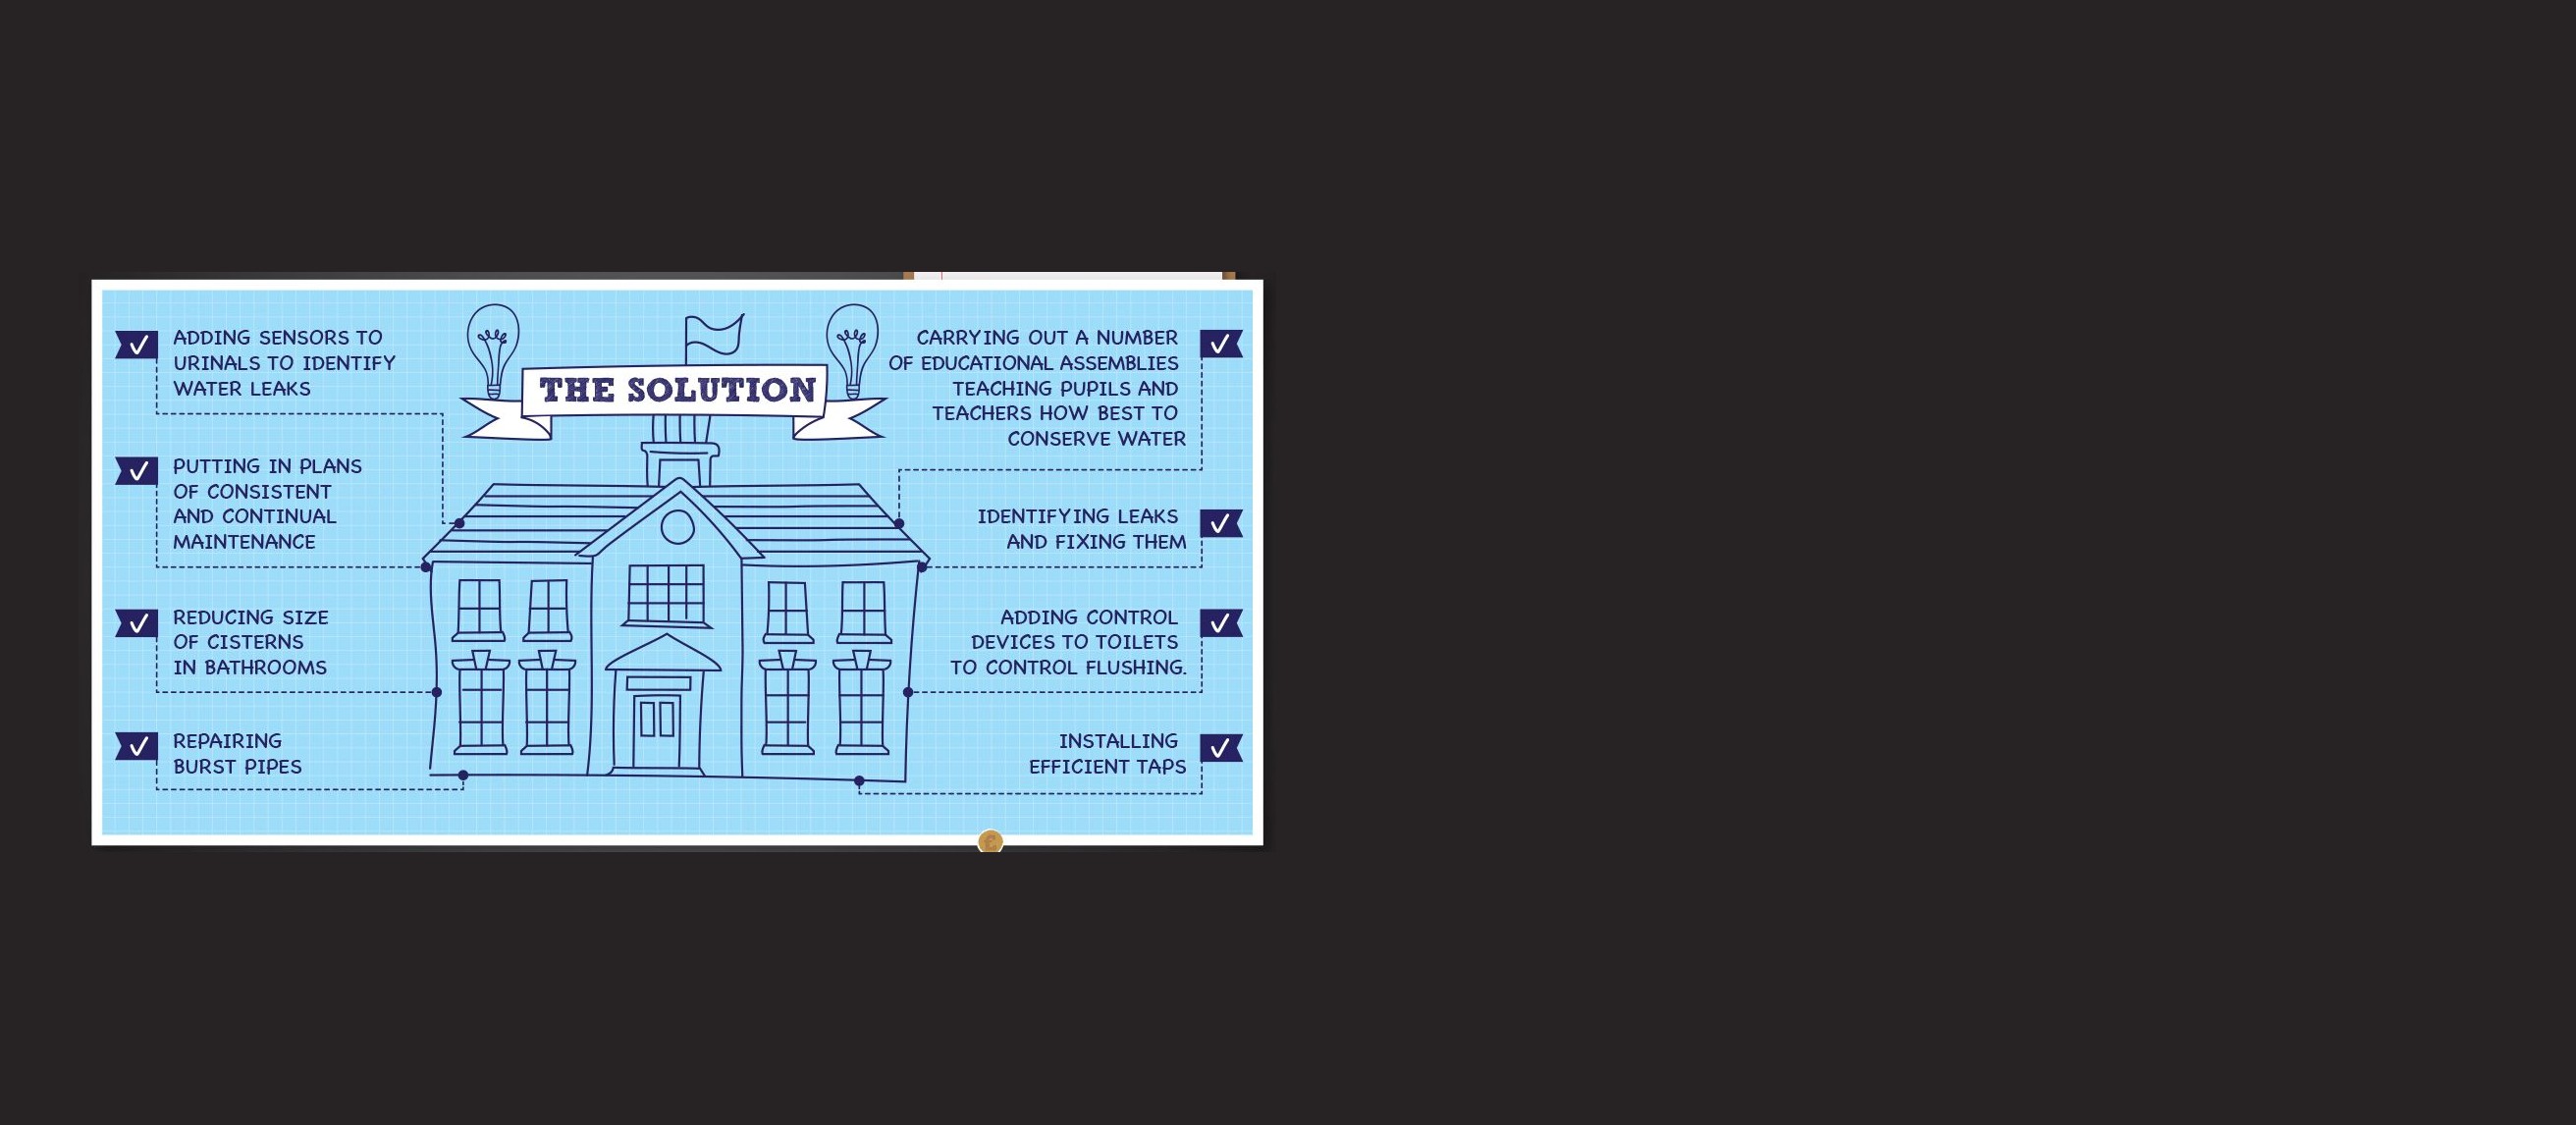


Make the numbers count: Strong numbers still get lost in a long document. Good design is there to stop that.
Get the data straight: We tidy the numbers before anything is drawn. On a data project, that is usually where most of the effort goes.
Find the story: We distil the findings into a few short, clear messages and set a tone that is friendly as well as professional.
Make a dry subject clear: Regulation, payroll, outsourcing. We have turned subjects busy readers have little time for into infographics and animations that explain them quickly.
Design, print and launch: Infographics, layouts, photography and film, seen through to print and launch, with an interactive version where it earns its place.
Reports and data we have designed
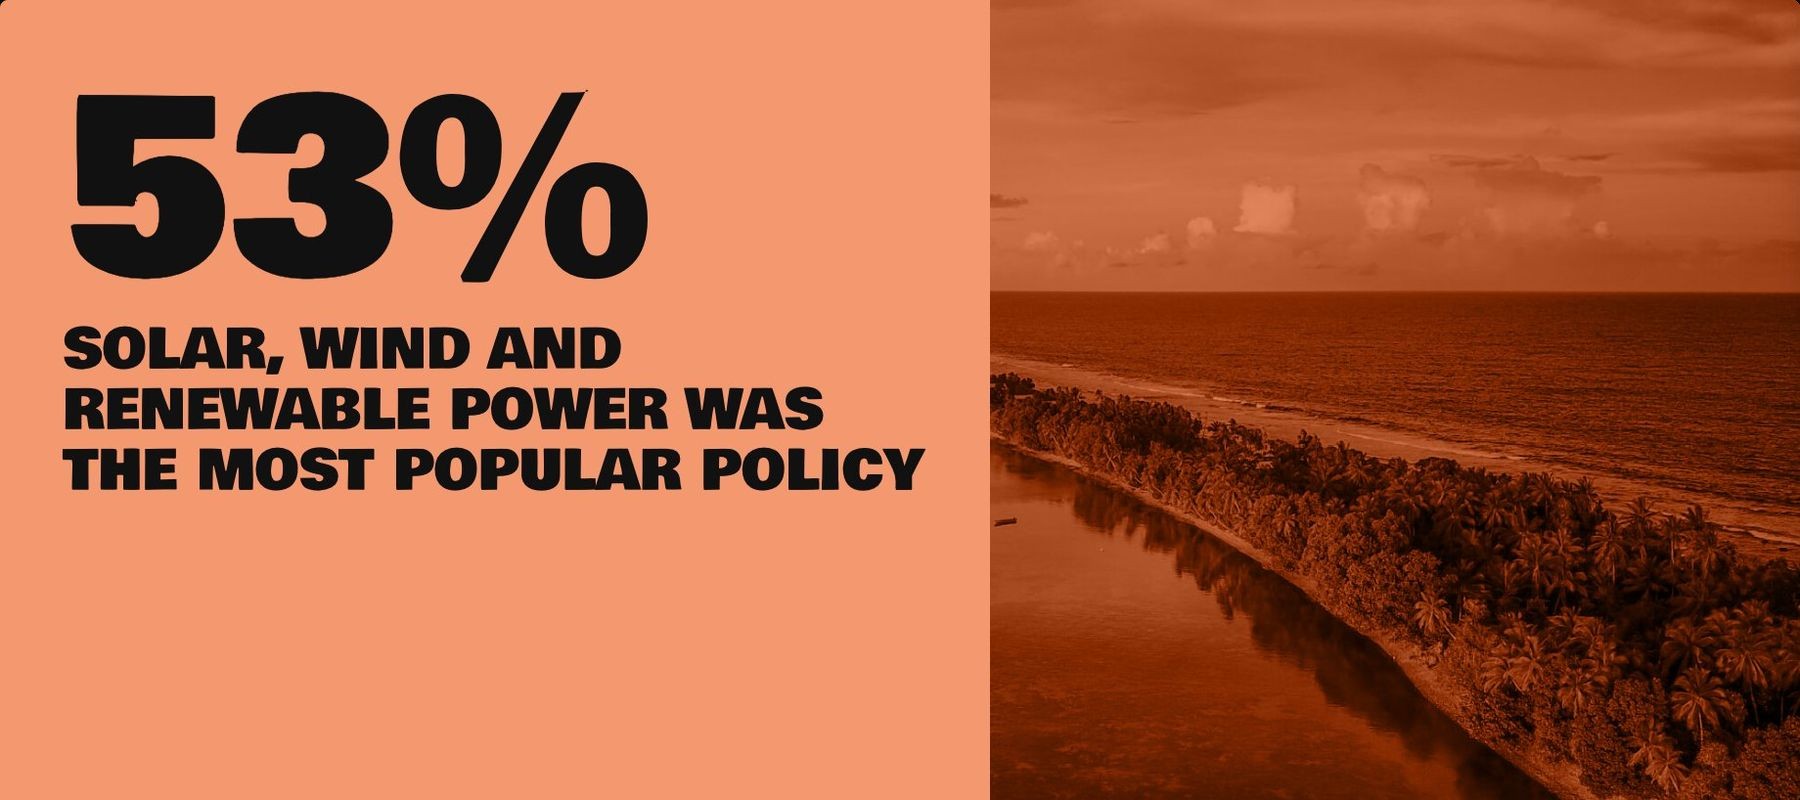 Peoples’ Climate VoteA world poll you can explore: a world map, a data centre and results you can save and share.
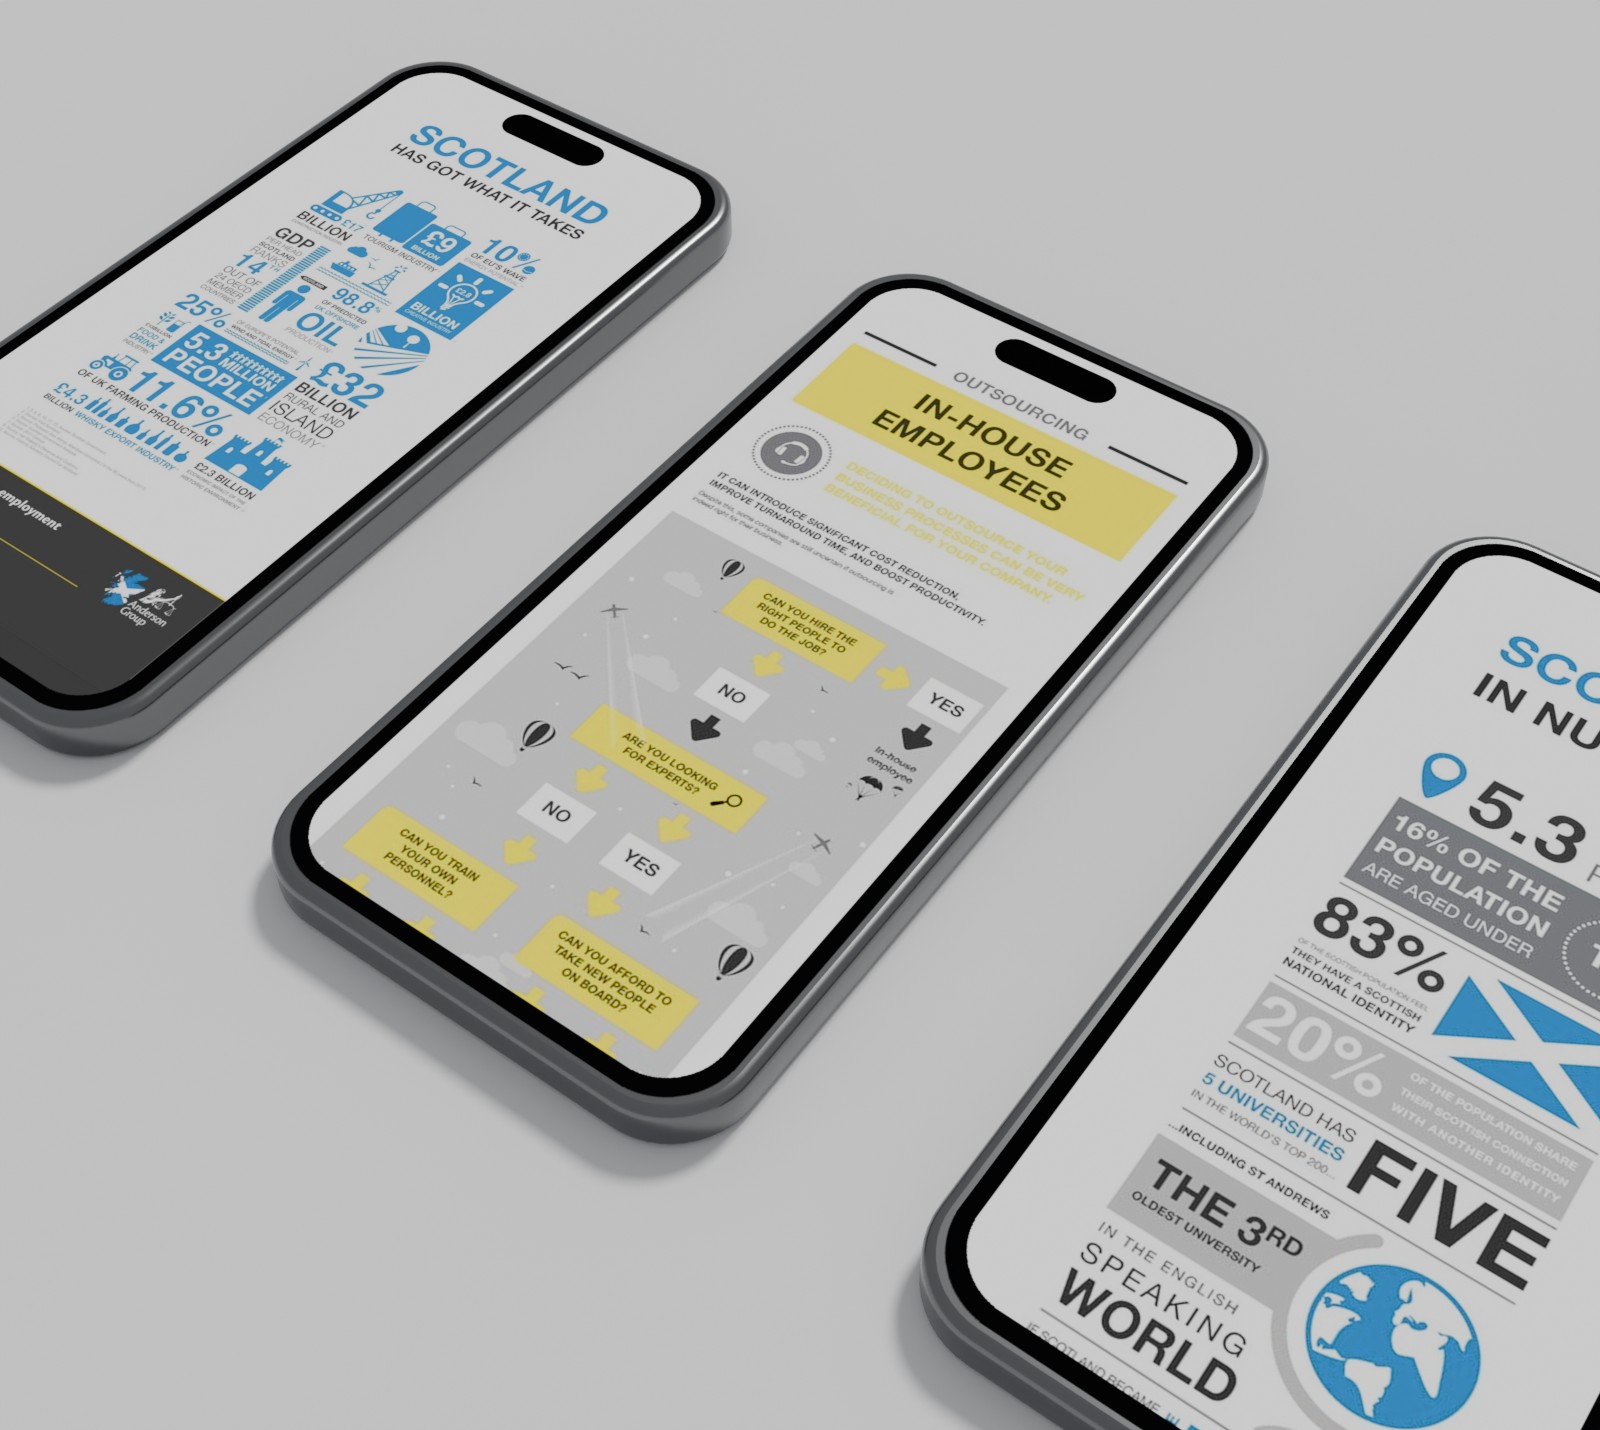 Anderson GroupBrochures, sales material, infographics and a suite of animations to debunk the myths of outsourcing.
 ConergyAn Autarky animation that promoted the benefit of solar in a user-friendly, jargon-free and light-hearted style.
What good report design does
- 01
Puts the key findings first
We distil the findings into short, punchy messages and statistics a reader can take in at a glance.
- 02
Sounds approachable, stays professional
Your readers may range from private clients to local authorities. The tone has to suit all of them without losing credibility.
- 03
Mapped out first
We map the report out in a sitemap and wireframes before the design starts.
- 04
Works in print and on screen
We design the printed and digital versions together, with photography and film where they help.
- 05
Lets readers explore the data
When there is more data than a page can hold, readers can pick a region, a group or a question and land straight on the result.
- 06
Gives findings a life beyond the report
Results can be designed to save as an image or share straight to social, so a finding travels further than the document.
A yearly impact report, made interactive.
Anthony Collins Solicitors publish a yearly social impact report and wanted to move away from a lengthy printed one.
We made an interactive report with short, punchy messages, animated infographics for the key findings, and film and photography, with the print assets and a bespoke mailer to support it.
Read the Anthony Collins case studyQuestions we are asked
Can you design a printed and an interactive version of the same report?
Yes. For Anthony Collins Solicitors we made their social impact report interactive, and helped pull together the print and digital assets, photography and printing so everything was ready for launch.
We have a lot of data. Where do we start?
With the data itself. On the Peoples’ Climate Vote, survey files arrived with inconsistent names and missing answers, so we wrote the mapping that cleaned them and a data centre where researchers could download the tables behind every chart.
Do you write the words, or only design them?
Both, if you need it. For Anthony Collins we distilled the findings into short, punchy messages and statistics. If your words are already written, we design around them.
How much does it cost, and how long does it take?
It depends on the length of the report, how much data sits behind it, and whether you need print, an interactive version, film or all three. The best place to start is an Intro with Ideate, a free 60 minute consultation where we look at your challenge and give you an honest view.
“The Energy Saving Trust are working to address the climate emergency, and they made us a preferred agency supplier. Our part ran from annual reports, guides and infographics to animating their data. Work with that kind of purpose behind it is what makes the job worthwhile for me.”